Database analysis results
Results
Database analysis
Co-variation in welfare indicators
Regardless of housing system it is possible from the available database to determine whether there are significant correlations between the different welfare indicators employed at the flock level. Production variables were not included in these analyses. Bivariate correlations were examined where a minimum of 12 flocks was available. To reduce errors associated with multiple unplanned comparisons only results where p < 0.01 are reported.
Only a handful of correlations were significant at chosen level. Bird mortality was negatively associated with the percentage of birds perching (Pearson –0.53, n = 114, p < 0.001) and positively associated with the proportion of birds with pecks to the comb (Pearson 0.26, n = 131, p = 0.003). Although the sample size was very small, there was also a strong negative correlation between heterophil:lymphocyte ratio and mortality (Pearson –0.69, n = 14, p < 0.001). The percentage of birds perching was negatively associated with water intake (Pearson, - 0.65, n = 24, p < 0.001).
It is difficult to draw too many conclusions about the general lack of correlations between indicators, as the number of flocks available with data on both indicators was too small to analyse in many cases. However, there were still hundreds of comparisons where correlations might have been detected and were not. As indicated in the introduction, one of the major challenges in drawing overall conclusions about bird welfare is a lack of association between the different indicators assessed. This appears to be a problem with the current LayWel database on European hen welfare.
Mortality
Using all the available data on mortality, a model was produced with an R-Squared value of 0.55 (adjusted value 0.51). Some variables did not explain significant amounts of variation in bird mortality (e.g. rearing system) but there were five variables that were significantly associated with bird mortality. These were:
- beak trimming - significantly higher mortality in groups of non-beak trimmed hens (F=21.5, d.f. 1, 331; p<0.0001)
- season (F=7.7, d.f. 4, 331; p<0.0001). Birds placed in laying accommodation in the winter months had lower mortality than birds placed in laying accommodation at other times of year.
- An interaction between housing system and whether the study of that housing system was conducted on commercial farms, experimental units or in a large-scale semi-commercial test facility (F=5.3, d.f. 11, 331; p<0.001). It is interesting and important that there was no significant main effect of housing system, only an interaction with whether the system was run under truly commercial conditions or within a scientific institute. This suggests that differing management practices had just as big an impact on bird mortality as the housing systems themselves. The nature of the interaction is important. Mortality in conventional cages, single-tier systems, and furnished cages with medium or large groups was much greater under experimental conditions than under commercial or test-scale conditions. Mortality in multi-tier systems was not greatly affected by whether the conditions were commercial or experimental. In small-group furnished cages, the lowest mortality was found under test-scale conditions, with little difference between commercial and experimental conditions.
- feather colour (F=5.0, d.f. 3; 331; p=0.002) – the analysis compared white, brown and hybrid birds, and studies that had housed a mixture of brown and white birds. Overall white-feathered genotypes appeared to show lower mortality than brown-feathered hens.
- country (F=4.2, d.f. 5, 331; p=0.001).
The significant effect of all these factors when included together in one model shows that they are all important. Thus, even though different countries studied different systems, genotypes and beak-trimming practices, residual differences between countries existed once these other explanatory variables had been included in the model. However, the degree of confounding within the data base makes interpretation of the results quite complex by simple examination of grouped means. It is well established both scientifically and from practical experience that beak trimming reduces mortality in general, which is why the practice came to be used. It might however be a peculiarity of the LayWel data that beak-trimmed white birds had an average 6% mortality, which was more than doubled in brown birds with intact beaks, as there was not an even distribution of the number of birds of each genotype across systems, nor of beak treatment. Other risk factors such as group size could be more relevant predictors of mortality, and this is indicated by significantly greater mortality with larger group size in furnished cages and in non-cage systems (see WP3). However, some recent evidence gathered since the LayWel data base was closed, from groups of 40 and 60 hens in large furnished cages in the UK suggests that such cages, if well designed and managed, can have good feathering and low mortality even with intact beaked hens (Elson, 2005, personal communication).
For the database as a whole, mortality attributed to feather pecking and/or cannibalism accounted for approximately one third of all mortality. This varied between housing systems. Although there was no significant effect of rearing system on overall mortality, a more informal examination of the subset of data relating to subsequent mortality attributed to feather pecking and/or cannibalism in laying housing systems shows a possible relationship with rearing system, as shown in table 7.5.
There were too few and highly variable data records to analyse these relationships formally but it would be informative if future studies could examine the consequences of rearing pullets in furnished cages if this was to be their housing system during lay. Indeed there is a pressing need both for new systematic experimental work on the design and influence of rearing systems on subsequent welfare of laying hens in all housing systems, and for all studies and commercial producers to record and monitor the impact of rearing systems.
Table 7.5 Effect of rearing system on mortality due to pecking or cannibalism in the main categories of housing system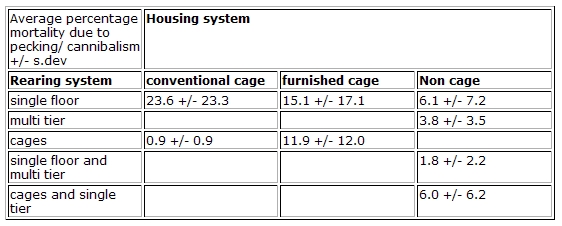
Plumage condition
The majority of studies included in the database had assessed plumage scores on scales that could be and were converted to a 100 point scale, where 100 represents full feather cover. Using these data, feather cover on average was similarly poor in the three main categories of housing system, with mean overall plumage scores of 45 (see Figure 7.1). There was considerable variation between as well as within housing systems (see also WP3).
However, a significant minority of studies had not assessed plumage scores but had, rather, assessed the percentage of birds within a flock with poor feather cover. In order to include all studies with information on plumage together in one analysis, the following steps were taken:
The plumage scores on the 0 – 100 scale were relatively normally distributed. The mean and standard deviation of plumage scores were calculated as 40.6 sd 23.2. The flocks were re-classified into four categories: good (scores > 1sd above the mean), above average (scores 0-1sd above the mean), below average (scores 0-1sd below the mean) and poor (scores > 1sd below the mean).
The data on proportion of birds in a flock with poor plumage were not normally distributed. The median and inter-quartile range were therefore used to re-classify flocks into good (< 7.5% with poor plumage), above average (7.5-15.5% with poor plumage), below average (15.5.-35.5% with poor plumage) and poor (> 35.5% with poor plumage).
Although this is a rough and ready method of re-classification it does permit inclusion of data from ALL flocks within the database into the same analysis of factors associated with poor plumage. A model was produced with an R-Squared value of 0.46 (adjusted value 0.38). Some variables did not explain significant amounts of variation in bird mortality. There was no main effect of housing system and, surprisingly, no effect of beak treatment, once other explanatory variables had been entered. However, there were five explanatory variables that were significantly associated with plumage category. These were:
- rearing system (F=10.2, d.f. 3; 207, p<0.0001) Birds reared in floor systems tended to have better plumage than birds reared in cages.
- country (F=7.2, d.f. 6, 207, p<0.0001)
- feather colour - white birds tended to have better feather cover (F=6.5, d.f. 4, 207; p<0.0001)
- season (F=4.5, d.f. 4, 207; p=0.002) Birds placed in laying accommodation in spring or summer months tended to have better plumage than birds placed in autumn or winter
- Interaction between housing category and whether the study of that housing system was conducted on commercial farms or experimental units (F = 3.4; d.f. 5, 207; p = 0.005). In general, commercial conditions in conventional cages and small-group furnished cages resulted in better plumage than experimental conditions, but the converse was the case for single-tier, multi-tier and large group furnished cage systems.
The lack of an effect of beak treatment on plumage compared to its important effect on mortality, suggests that beak trimming may have a stronger influence on reducing severe injurious pecking resulting in cannibalism than it does on the type of gentle feather pecking that may reduce plumage condition.
The very strong significant effect of rearing system on plumage condition is interesting. It suggests again that there is a need for more information on the factors in rearing that affect subsequent welfare.Production
Recorded egg production was higher in cage than non-cage systems on average and this could reflect misplaced eggs in non-cage systems or indeed be a biological reality related to greater temperature fluctuations and exercise levels. See WP 6 for more details.
Feed intake
Unsurprisingly, feed consumption was higher in non-cage systems in which the hens exercise more and may have access to range and be exposed to greater variation in ambient temperature. The feed conversion rate (FCR) was correspondingly poorer than cage systems. See WP 6 for more details. This is of course not a concern for the welfare of the hens.
Relationships between these variables
Considering the four variables outlined above, there was little difference between average values for the three main system categories (i.e. conventional cages, furnished cages and non-cage systems).
Figure 7.1 shows that in non cage systems overall, there was a tendency for productivity to be lower, for feather cover to be improved and for mortality to be higher compared with cage systems. However it is necessary to examine the systems in more detail because of variability and because of the limitations of the database already discussed.
More relevant for many stakeholders is a comparison of the three systems with substantial data obtained from commercial farms, which are small furnished cages (FC-small) with group sizes of up to 15 hens per cage; multi-tiered aviaries where nestboxes are separate from the tiers (MT-NN); and single tier non-cage systems (ST-NC) (see Table 7.4). So, considering just these three systems, Figure 7.2 indicates that productivity was on average better in single tier non-cage systems, due in part to lower mortality. There was high variation in plumage scores within systems. On average feather cover was poor in multi-tier aviaries with non-integrated nestboxes, yet single tier non-cage systems showed the greatest variation from flocks with full feather cover and undamaged plumage (score 100) to those almost denuded with mean overall scores of 13. Table 7.6 shows the proportion of these flocks that were beak-trimmed, where this information was recorded.
Note that the differences shown in figures 7.1 and 7.2 may not be statistically significant – they merely indicate the arithmetical means from the LayWel database and not even the mean of all individual birds that were scored. However the means shown in Figure 7.2 are for the three systems that had the most data – over 50 studies per system in 3 or more countries and mainly of commercial flocks - and are likely to be much more representative of these three particular systems. (All the data entered in the database are included for these three housing systems in Figure 7.2).
Figure 7.1 A comparison of mean (& st.dev.) egg production, feed intake, plumage (feather) score and laying hen mortality between all non-cage, conventional cage and furnished cage systems
[using all the data available from the LayWel database for all housing systems]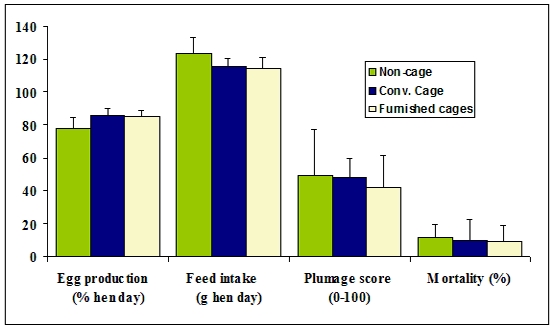
Figure 7.2 A comparison of mean (& st.dev.) egg production, feed intake, feather score and laying hen mortality between single tier non-cage (ST-NC), multi-tier (MT-NN) and small furnished cage (FC-small) systems [data from the LayWel database for three housing systems each with over 50 studies in 3 or more countries] 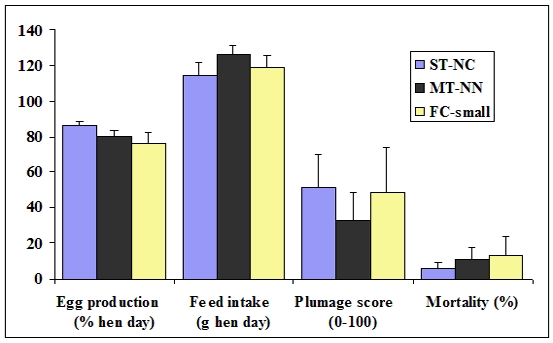
Table 7.6 Beak trimming practice in three systems
| Beak treatment | single tier non-cage | multi-tier (MT-NN) | FC-small (<16 birds) |
| None | 9 (30.0%) | 77 (92.8%) | 97 (69.3%) |
| Trimmed at 1-10 d | 21 (70.0%) | 6 (7.2%) | 43 (30.7%) |